In the wild world of music production and distribution, having access to real-time data and analytics is crucial for any artist or band to grow. Lets explores how BLCK CLD COLLECTIVE, an independent record label, transformed their data management using Snipowl and saved over $1000.
The Challenge
Nate at BLCK CLD COLLECTIVE, faced a significant challenge: creating a centralized hub for up-to-date data, analytics,file hosting and communication for his record label. With a background in music rather than web development, he embarked on a journey to learn front-end coding languages such as HTML, CSS, and JavaScript.
The most daunting task was building a dashboard that could provide real-time information on music streams, follows, and other vital metadata for his team. This challenge led Nate down a complex path of API integrations and data visualization tools. There was no simple solution.
The Frankenstien Solution
After extensive research on data viz software and api visualization tools, Nate initially settled on a crazy multi-step process that would make Frankenstien proud:
- Connect to Songstats API for music data collection ($100/month)
- Use Google Scripts to convert Songstats data into an Excel sheet
- Import the Excel sheet into Infogram for graph creation ($25/month)
- Embed Infogram graphs into their dashboard
This solution, while functional, proved to be both expensive and cumbersome. The total cost being $125 per month or $1,500 a year, and the process was prone to errors and inconsistencies. The challenges didn't end there.
Unexpected Obstacles
Upon implementation, Nate discovered that Spotify required label verification to access their metadata. This led to another month-long process of communication with Spotify support. Even after verification, the data retrieved was inaccurate, and the graphs showed no performance metrics.
The Snipowl Solution
Frustrated with the complex and unreliable process, Nate wished for a simpler solution - a way to grab the exact data, without the hassle. Well luckily for Nate, they discovered Snipowl through a Twitter post.
Snipowl offered exactly what Nate needed: a straightforward, reliable method to capture and display data from multiple platforms. The tool's simplicity and effectiveness made it an instant hit with BLCK CLD COLLECTIVE.
Results and Benefits
By utilizing Snipowl, BLCK CLD COLLECTIVE experienced significant improvements:
- Cost-Savings: Eliminated the need for expensive API subscriptions and data visualization tools. (Snipowl $19 vs $125 Frankenstien method )
- Simplification: Snipowl streamlined the data collection and presentation process.
- Accuracy: Made the data displayed matched what was visible on the original platforms.
- Time-Saving: Reduced the time spent on data management and troubleshooting.
- Flexibility: Allowed easy capture of data from various sources without complex integrations.
Conclusion
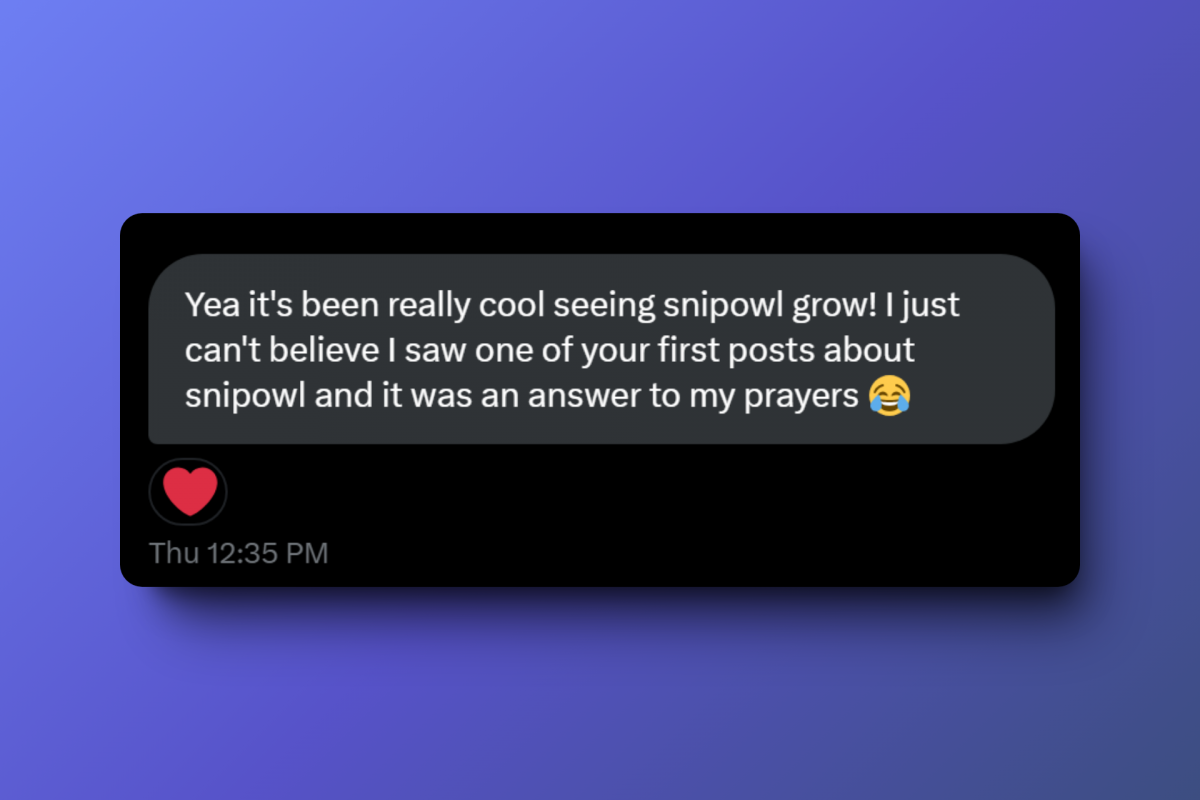
The journey of BLCK CLD COLLECTIVE went from a complex, expensive, and unreliable data management system to a streamlined workflow that matches his needs. For this independent record label, Snipowl wasn't just a tool - it was, in the Nate's own words, "An answer to my prayers."
This case study demonstrates how Snipowl can transform data management workflows, making it an invaluable asset for businesses in the music industry and beyond. If you're interested in building your own dashboard, try Snipowl today for free!


